Free Access
Fig. 1
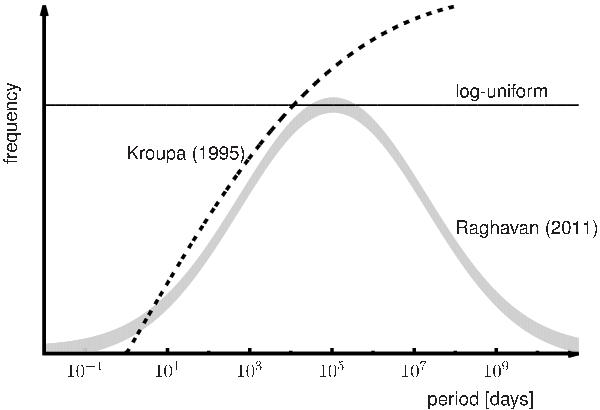
Schematic picture of possible initial period distributions. The thick grey curve displays the log-normal fit to the data of Raghavan et al. (2010), the thick dashed line the Kroupa (1995a), and the solid line a log-uniform period distribution, which is observed for many young star-forming regions (see text for references).
Current usage metrics show cumulative count of Article Views (full-text article views including HTML views, PDF and ePub downloads, according to the available data) and Abstracts Views on Vision4Press platform.
Data correspond to usage on the plateform after 2015. The current usage metrics is available 48-96 hours after online publication and is updated daily on week days.
Initial download of the metrics may take a while.