Free Access
Fig. 6
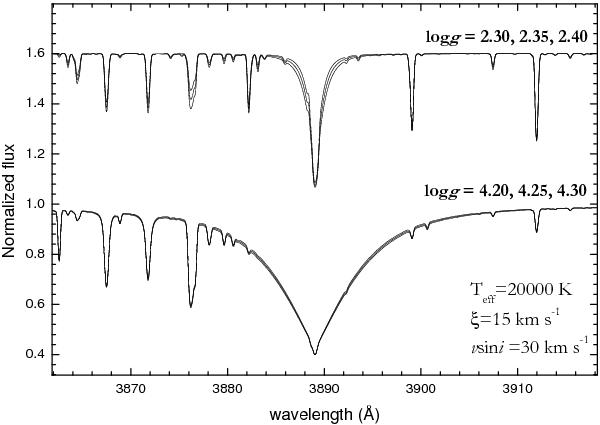
Comparison between wings of hydrogren profiles computed for dwarf (bottom) and evolved stars (top), considering different values of log g, in steps of 0.05 dex. The lower the value of log g, the higher the sensivity of the line wings to the surface gravity.
Current usage metrics show cumulative count of Article Views (full-text article views including HTML views, PDF and ePub downloads, according to the available data) and Abstracts Views on Vision4Press platform.
Data correspond to usage on the plateform after 2015. The current usage metrics is available 48-96 hours after online publication and is updated daily on week days.
Initial download of the metrics may take a while.