Fig. 1
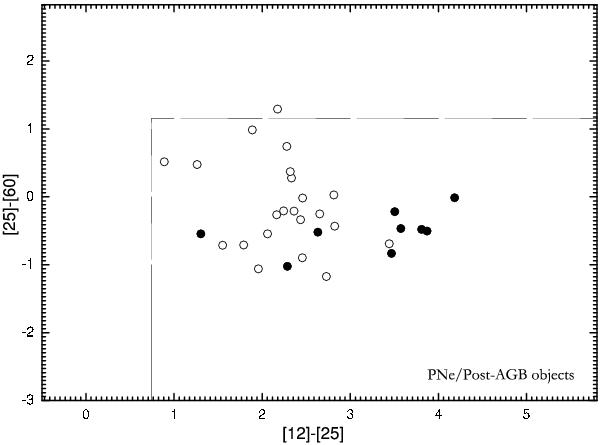
IRAS colour–colour diagram showing the location of all the objects of our sample (filled circles), except for LSE 148, which has no measurements of IRAS fluxes. Solid lines shows the post-AGB/PNe locus defined by Pottasch et al. (1988). Open circles represent the sample of Galactic PNe of Perinotto et al. (2004) for comparison.
Current usage metrics show cumulative count of Article Views (full-text article views including HTML views, PDF and ePub downloads, according to the available data) and Abstracts Views on Vision4Press platform.
Data correspond to usage on the plateform after 2015. The current usage metrics is available 48-96 hours after online publication and is updated daily on week days.
Initial download of the metrics may take a while.