Free Access
Fig. 10
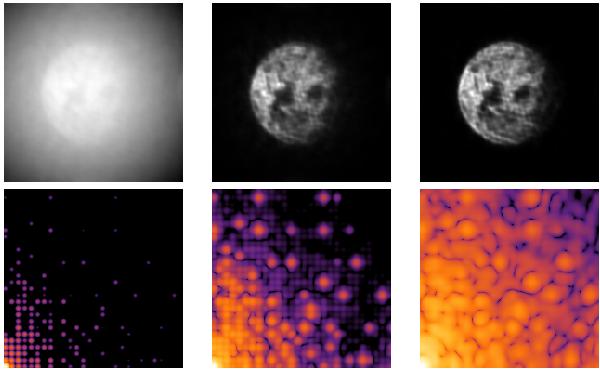
Deconvolution of rediluted noiseless images. Top: from left to right, result of RLA on the re-diluted images for k = 10,1000, and 10 000. Bottom: corresponding modulus in the Fourier plane. Only a limited part of the first quadrant of the Fourier plane is shown.
Current usage metrics show cumulative count of Article Views (full-text article views including HTML views, PDF and ePub downloads, according to the available data) and Abstracts Views on Vision4Press platform.
Data correspond to usage on the plateform after 2015. The current usage metrics is available 48-96 hours after online publication and is updated daily on week days.
Initial download of the metrics may take a while.