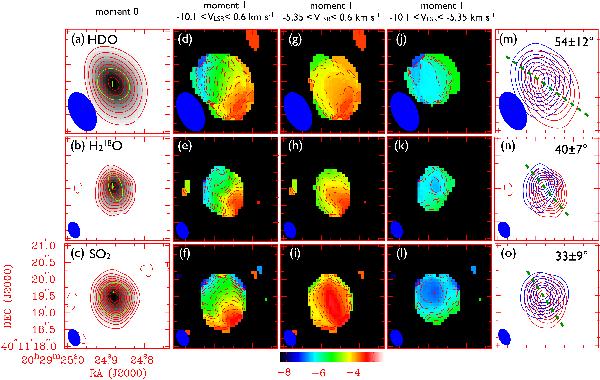
Fig. 3

a)–c) Zero moment maps of HDO, H O and SO2 around VLA3, respectively. The contours are at − 3, 3, 6, 9...σ for all three maps, where 1σ noise levels are 10, 37 and 65 mJy km s-1 for HDO, H
 O and SO2, respectively. The green crosses mark the positions of emission peaks. The green ellipses represent FWHM sizes derived from visibility fit. The green filled circles indicate the positions of the additional point sources in the visibility fit of H
 O and SO2. The natural-weighted clean beam sizes, shown in blue filled ellipses, of HDO and H
 O/SO2 are
  , PA 26° and
  , PA 22°, respectively. d)–l) First moment maps of HDO, H
 O and SO2 around VLA3, respectively. For all nine maps, the color scales are set to be the same. Dashed lines represent the isovelocity contours with an interval of 0.25 km s-1. m)–o) Molecular emission integrated over the velocity ranges of −5.35 < VLSR < 0.6 km s-1 (red contours) and −10.1 < VLSR < −5.35 km s-1 (blue contours) for HDO, H
 O and SO2, respectively. Contours are plotted with 10% interval of peak value of each velocity component. The inferred position angles of the velocity gradients across VLA3 are plotted as green dashed lines.
Current usage metrics show cumulative count of Article Views (full-text article views including HTML views, PDF and ePub downloads, according to the available data) and Abstracts Views on Vision4Press platform.
Data correspond to usage on the plateform after 2015. The current usage metrics is available 48-96 hours after online publication and is updated daily on week days.
Initial download of the metrics may take a while.


