Free Access
Fig. 3
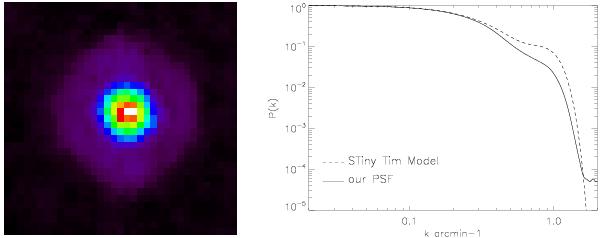
Left: point spread function (PSF) of MIPS 160 μm computed using an oversampled map. Right: PSFs power spectra. The continuous line is our PSF and the dashed line is the power spectrum from the STiny Tim Model (Krist et al. 2005, STinyTim, v1.3; Krist 2002).
Current usage metrics show cumulative count of Article Views (full-text article views including HTML views, PDF and ePub downloads, according to the available data) and Abstracts Views on Vision4Press platform.
Data correspond to usage on the plateform after 2015. The current usage metrics is available 48-96 hours after online publication and is updated daily on week days.
Initial download of the metrics may take a while.