Fig. 17
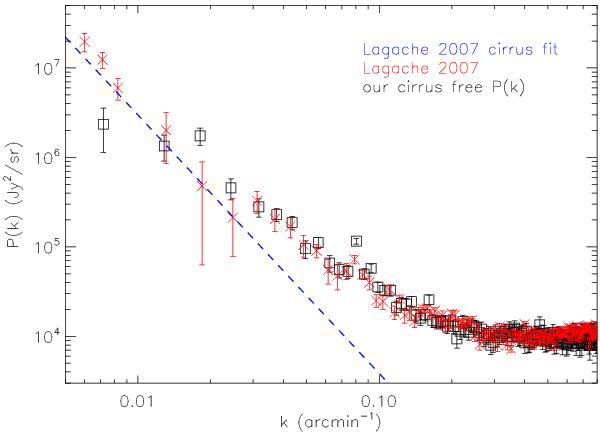
Black squares are the resulting power spectrum of the CIB anisotropies computed by removing the cirrus contamination using Hi data in the ELAIS N1 field. Red crosses represent the Lagache et al. (2007) power spectrum computed in the Lockman-Hole field. It includes both CIB and cirrus anisotropies and the blue dashed line shows their estimate of the cirrus power spectrum.
Current usage metrics show cumulative count of Article Views (full-text article views including HTML views, PDF and ePub downloads, according to the available data) and Abstracts Views on Vision4Press platform.
Data correspond to usage on the plateform after 2015. The current usage metrics is available 48-96 hours after online publication and is updated daily on week days.
Initial download of the metrics may take a while.