Fig. 16
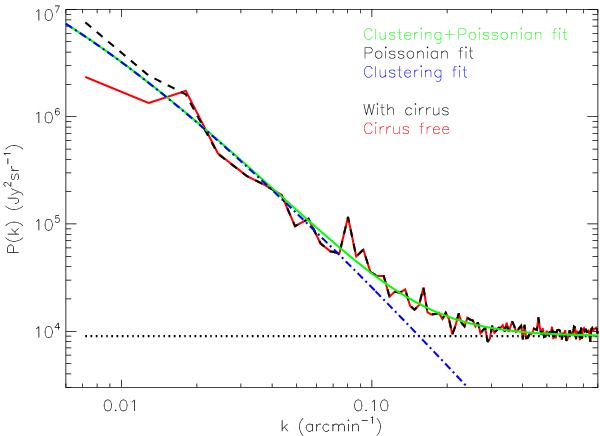
MIPS power spectrum at 160 μm. The dashed black line shows the power spectrum of the raw map (noise subtracted and divided by the PSF power spectrum). The red line represents the power spectrum of the map to which the cirrus emission has been subtracted. The blue dash-dotted line shows our fit to the power spectrum of the clustering and the black horizontal dotted line is the fit to the Poisson noise level. The green line shows the sum of the clustering and Poisson components. Error bars are not shown for display purposes.
Current usage metrics show cumulative count of Article Views (full-text article views including HTML views, PDF and ePub downloads, according to the available data) and Abstracts Views on Vision4Press platform.
Data correspond to usage on the plateform after 2015. The current usage metrics is available 48-96 hours after online publication and is updated daily on week days.
Initial download of the metrics may take a while.