Fig. 15
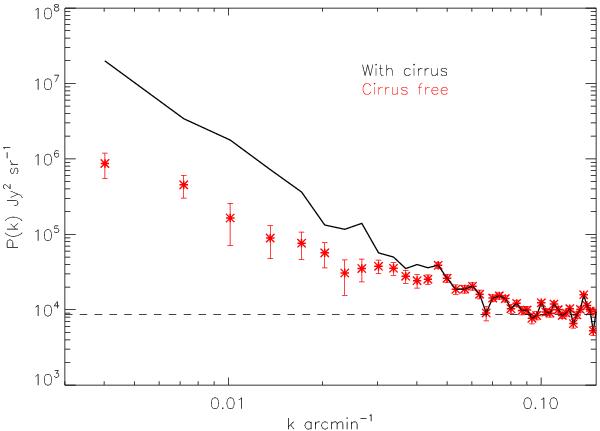
Red crosses show the CIB anisotropies power spectrum computed at 100 μm. The contribution of the cirrus has been removed following Sect. 5.2. The power spectrum of the noise has been subtracted and the resulting power spectrum has been divided by the power spectrum of the PSF. The black line is the power spectrum of the map that contains the cirrus contamination. The dashed line shows the level of the Poisson noise which is 8.7 × 10³ Jy2/sr.
Current usage metrics show cumulative count of Article Views (full-text article views including HTML views, PDF and ePub downloads, according to the available data) and Abstracts Views on Vision4Press platform.
Data correspond to usage on the plateform after 2015. The current usage metrics is available 48-96 hours after online publication and is updated daily on week days.
Initial download of the metrics may take a while.