Fig. 14
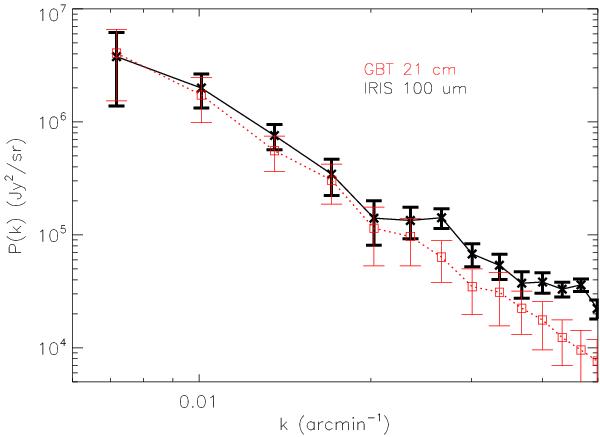
The black continuous line with the crosses and bold error bars show the power spectrum of IRIS 100 μm and the red dotted line with squares and thin error bars represents the power spectrum of the emission of the cirrus at 100 μm calculated from the Hi map. The discrepancy observed for k > 0.02 arcmin-1 is due to the clustering of SB galaxies (see Sect. 6.2).
Current usage metrics show cumulative count of Article Views (full-text article views including HTML views, PDF and ePub downloads, according to the available data) and Abstracts Views on Vision4Press platform.
Data correspond to usage on the plateform after 2015. The current usage metrics is available 48-96 hours after online publication and is updated daily on week days.
Initial download of the metrics may take a while.