Fig. 13
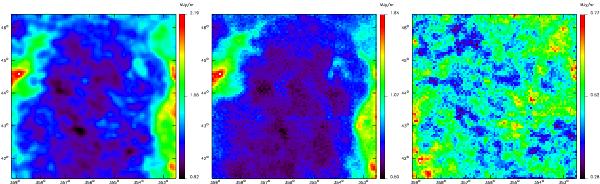
The left panel shows the IRIS 100 μm map projected on the GBT map and convolved with the GBT beam. The emission of the cirrus (local+IVC+HVC) at 100 μm (the emissivity × NHI) is shown in the middle panel and the right one represents the IRIS 100 μm map convolved by the beam of the GBT from which we have subtracted the cirrus emission.
Current usage metrics show cumulative count of Article Views (full-text article views including HTML views, PDF and ePub downloads, according to the available data) and Abstracts Views on Vision4Press platform.
Data correspond to usage on the plateform after 2015. The current usage metrics is available 48-96 hours after online publication and is updated daily on week days.
Initial download of the metrics may take a while.