Free Access
Fig. 1
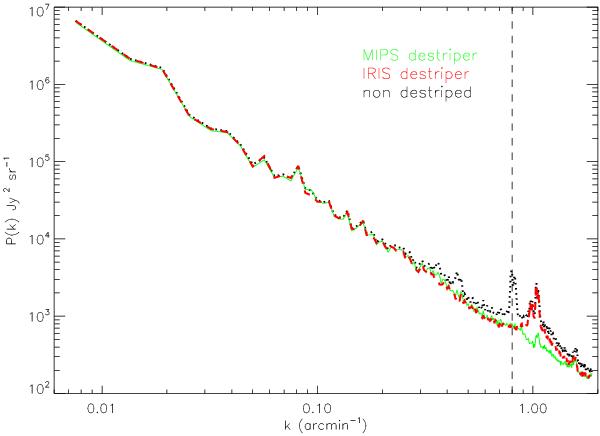
The dotted black line shows the power spectrum of the non destriped map, the dashed red curve is the power spectrum of the map destriped with the “IRIS destriper”, and the green line shows the power spectrum of the map destriped by “the MIPS destriper”. The vertical dashed line shows our angular scale cut of < 0.8 arcmin-1.
Current usage metrics show cumulative count of Article Views (full-text article views including HTML views, PDF and ePub downloads, according to the available data) and Abstracts Views on Vision4Press platform.
Data correspond to usage on the plateform after 2015. The current usage metrics is available 48-96 hours after online publication and is updated daily on week days.
Initial download of the metrics may take a while.