Fig. 1
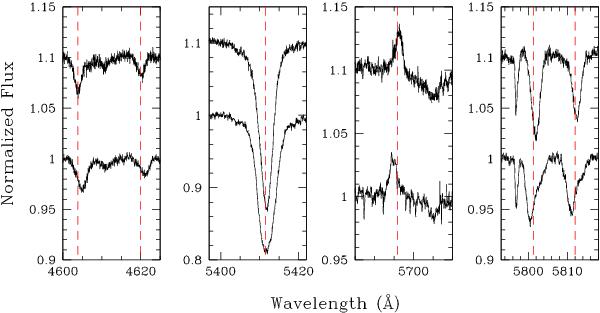
Various lines in the spectrum of 9 Sgr observed at two different epochs. The lower spectrum was taken on 10 July 2004 (HJD 2 453 196.586) whilst the uppermost spectrum was obtained on 5 October 2006 (HJD 2 454 013.526). From left to right, these lines illustrate the various behaviours that exist in the spectrum: lines predominantly formed in the atmosphere of the primary (N v λλ 4603, 4620), lines not showing any clear binary signature (He ii λ 5412), lines belonging to the secondary (C iii λ 5696) and lines displaying an SB2 signature (C iv λλ 5801, 5812). In each panel, the dashed red lines indicate the rest wavelengths of the lines.
Current usage metrics show cumulative count of Article Views (full-text article views including HTML views, PDF and ePub downloads, according to the available data) and Abstracts Views on Vision4Press platform.
Data correspond to usage on the plateform after 2015. The current usage metrics is available 48-96 hours after online publication and is updated daily on week days.
Initial download of the metrics may take a while.