Free Access
Fig. 9
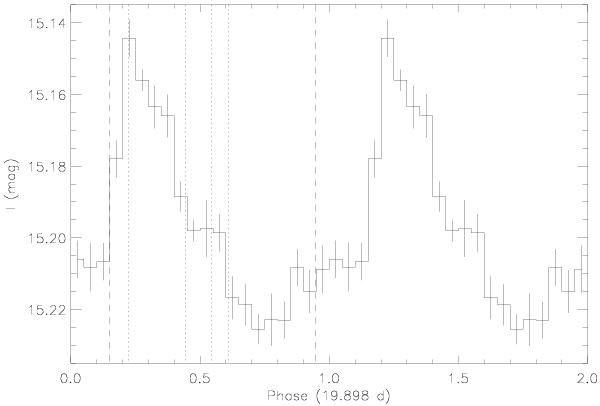
I-band light curve from OGLE III in the high state convolved with 19.898 days. Phase = 0 corresponds to MJD 54 640. Dotted lines give the phase of the beginning of the X-ray observations in 2011. Dashed lines mark the Swift/XRT non-detections.
Current usage metrics show cumulative count of Article Views (full-text article views including HTML views, PDF and ePub downloads, according to the available data) and Abstracts Views on Vision4Press platform.
Data correspond to usage on the plateform after 2015. The current usage metrics is available 48-96 hours after online publication and is updated daily on week days.
Initial download of the metrics may take a while.