Free Access
Fig. 7
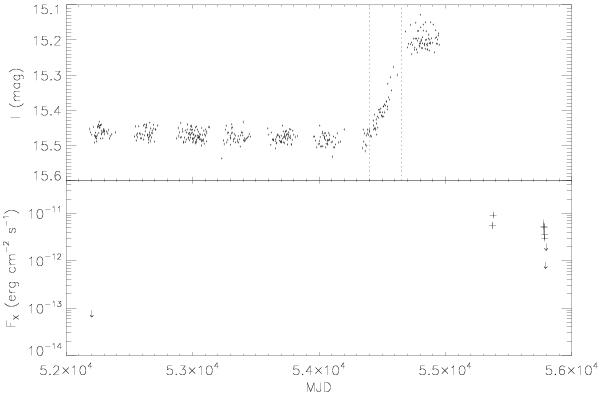
I-band light curve of OGLEIII LMC175.4.21714 (upper panel) compared to the X-ray fluxes with upper limits marked by arrows (lower panel). Dotted lines separate the optical low, transition, and high state.
Current usage metrics show cumulative count of Article Views (full-text article views including HTML views, PDF and ePub downloads, according to the available data) and Abstracts Views on Vision4Press platform.
Data correspond to usage on the plateform after 2015. The current usage metrics is available 48-96 hours after online publication and is updated daily on week days.
Initial download of the metrics may take a while.