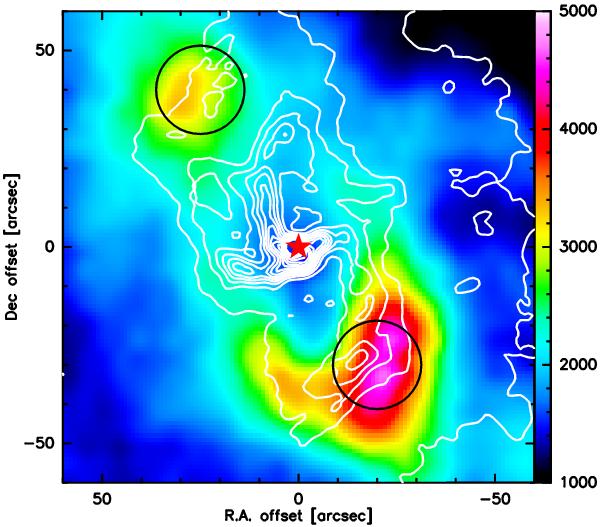
Fig. 1

CND in the emission of CO(6–5), observed with the CHAMP+ receiver at APEX. The CO intensity (color map in K km s-1, in Tmb) was integrated between −150 and 150 km s-1. The angular resolution of the map is 9.5′′. VLA 6cm radio continuum (contours, Yusef-Zadeh & Morris 1987) shows ionized gas in the “mini-spiral” near SgrA∗. The map is centered on SgrA∗ (red star), (EQ J2000) 17°45′39.9′′, −29h00m28.1s. The two circles denote the southern (CND-S) and northern (CND-N) emission maxima toward which our excitation studies are performed, at offsets of (−20′′, −30′′) and (25′′, 40′′). The diameter of the circles corresponds to the beam of GREAT at the frequency of the CO(11–10) transition (22.5′′).
Current usage metrics show cumulative count of Article Views (full-text article views including HTML views, PDF and ePub downloads, according to the available data) and Abstracts Views on Vision4Press platform.
Data correspond to usage on the plateform after 2015. The current usage metrics is available 48-96 hours after online publication and is updated daily on week days.
Initial download of the metrics may take a while.


