Fig. 2
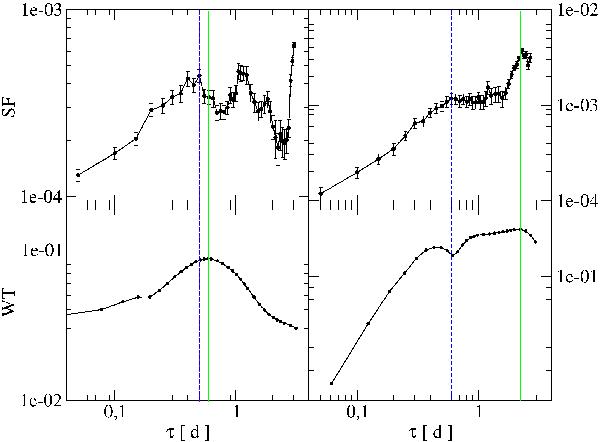
Upper panels: the structure function plots of the April 2006 (left panel) and April 2008 (right panel) datasets; the blue vertical lines show the estimated timescales. Lower panels: the wavelet-based analysis for the same epochs; the green vertical lines show the estimated timescales. The existence of two bumps in the right panels is the signature of two distinct variability components in the dataset.
Current usage metrics show cumulative count of Article Views (full-text article views including HTML views, PDF and ePub downloads, according to the available data) and Abstracts Views on Vision4Press platform.
Data correspond to usage on the plateform after 2015. The current usage metrics is available 48-96 hours after online publication and is updated daily on week days.
Initial download of the metrics may take a while.