Free Access
Fig. B.1
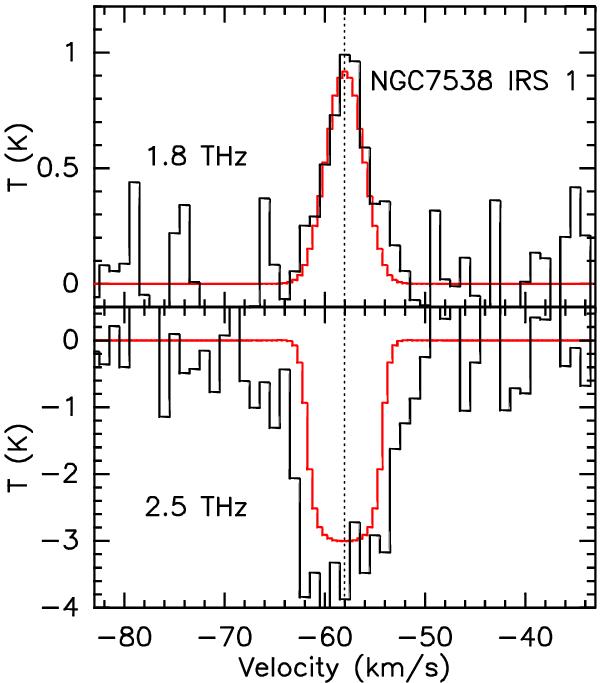
Our RATRAN model of the 1834 GHz and 2514 GHz OH line in emission and in absorption, respectively. Black line shows the observed spectra with baselines removed, the red line shows the model.
Current usage metrics show cumulative count of Article Views (full-text article views including HTML views, PDF and ePub downloads, according to the available data) and Abstracts Views on Vision4Press platform.
Data correspond to usage on the plateform after 2015. The current usage metrics is available 48-96 hours after online publication and is updated daily on week days.
Initial download of the metrics may take a while.