Fig. A.1
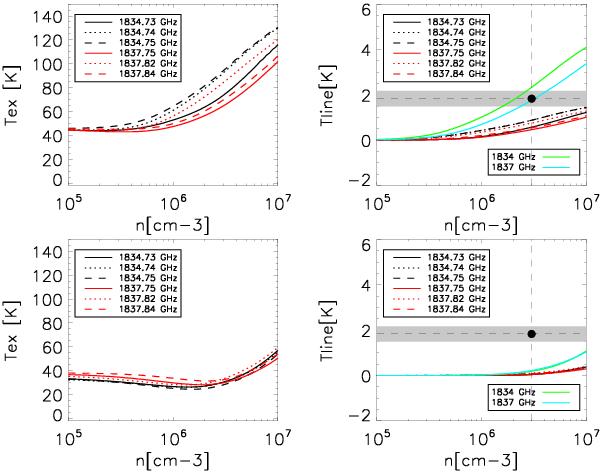
Results of the LVG models of Cesaroni & Walmsley (1991) showing only the predictions of excitation temperature and line intensity for the 1834 and 1837 GHz lines. The gray dashed area indicates the observed line intensity including the errors. Light green and blue lines correspond to the sum of the hfs lines in each component of the doublet. Upper panels: models with internal radiation field. Lower panels: models without internal radiation field.
Current usage metrics show cumulative count of Article Views (full-text article views including HTML views, PDF and ePub downloads, according to the available data) and Abstracts Views on Vision4Press platform.
Data correspond to usage on the plateform after 2015. The current usage metrics is available 48-96 hours after online publication and is updated daily on week days.
Initial download of the metrics may take a while.