Fig. 1
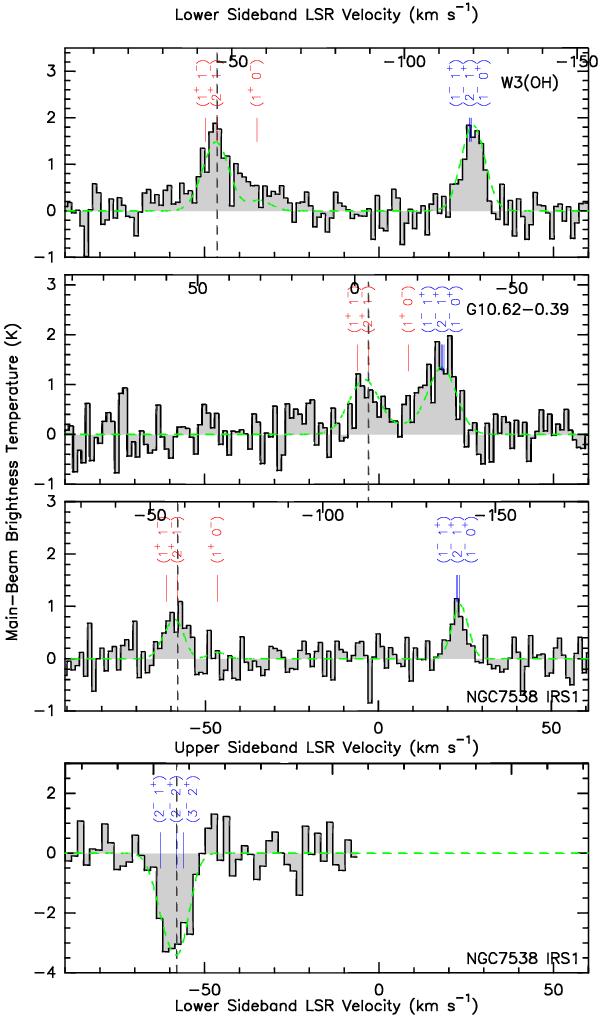
Upper three panels: the  rotational lines of the three UCHIIRs in emission. The gray dashed line shows vlsr. Red lines indicate the position of the hfs components of the – parity line of the doublet, while blue labels show the hfs of the + transition. (Labels are shifted for better visibility.) The dashed green line shows the τ = 0.1 hfs fit to the spectra. The lower sideband rest velocity is shifted according to the vlsr of the individual sources and is indicated on the upper axis of each plot, while the rest velocity scale is the same for all sources. The lowest panel shows the
  transition toward NGC 7538 IRS1.
Current usage metrics show cumulative count of Article Views (full-text article views including HTML views, PDF and ePub downloads, according to the available data) and Abstracts Views on Vision4Press platform.
Data correspond to usage on the plateform after 2015. The current usage metrics is available 48-96 hours after online publication and is updated daily on week days.
Initial download of the metrics may take a while.