Fig. 2
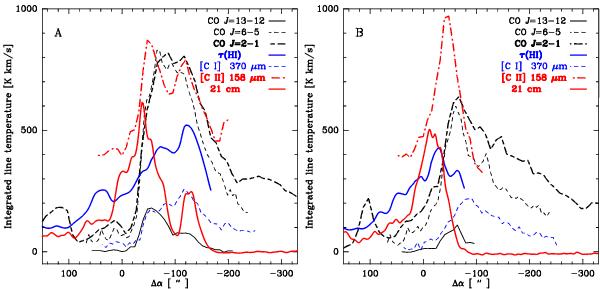
Left – strip lines of the molecular (12CO) and atomic ([C I], [C II]) gas at Δδ = 30′′ (PA 90°) across the ionization front of M17 SW. Right – strip lines at PA 63° (Δδ = Δα/2). The lower-J lines of 12CO, and [C I] are from Pérez-Beaupuits et al. (2010, their Fig. 3). All these profiles are in units of K km s-1 . The VLA 21 cm continuum and H I optical depth (integrated between 0 and 30 km s-1) by Brogan & Troland (2001) are in units of 500 × Jy beam-1 and 8 × τ(HI) km s-1 , respectively. The offset, Δα = 0′′ in RA, is the same as in Fig. 1.
Current usage metrics show cumulative count of Article Views (full-text article views including HTML views, PDF and ePub downloads, according to the available data) and Abstracts Views on Vision4Press platform.
Data correspond to usage on the plateform after 2015. The current usage metrics is available 48-96 hours after online publication and is updated daily on week days.
Initial download of the metrics may take a while.