Free Access
Fig. 7
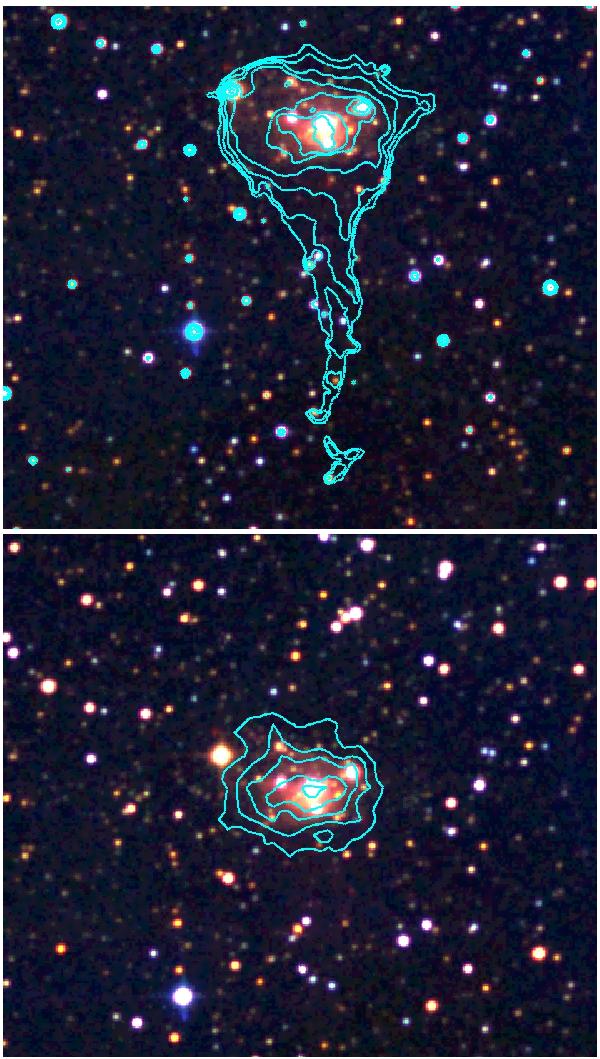
Near-IR image of the 6′ × 6′ field centered on the cluster in the globule (RGB coded from 2MASS Ks, H and J) with contours (28, 30, 35, 50, 125, 200, and 600 MJy/sr) of the Spitzer 5.8 μm image (top) and the [C II] (bottom) contours (3–11 K km s-1 in steps of 2 K km s-1) overlaid on it. North is up, east is left.
This figure is made of several images, please see below:
Current usage metrics show cumulative count of Article Views (full-text article views including HTML views, PDF and ePub downloads, according to the available data) and Abstracts Views on Vision4Press platform.
Data correspond to usage on the plateform after 2015. The current usage metrics is available 48-96 hours after online publication and is updated daily on week days.
Initial download of the metrics may take a while.