Fig. 6
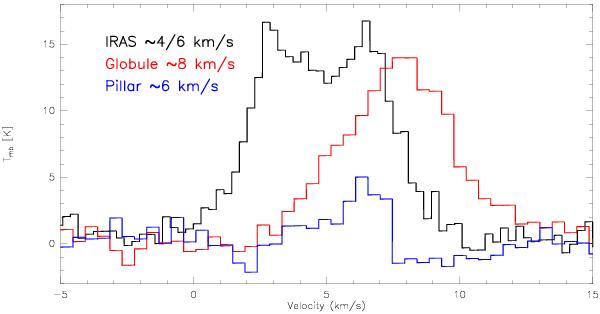
Representative [C II] spectra from the three observed regions, the pillar, globule (center position with bulk emission) and IRAS 20306+4005. The double-peaked spectrum from the IRAS source is due to two seperate components at around 4 and 6 km s-1. The [C II] spectrum of the globule (red) shows a shift of around 2 km s-1 with respect to the pillar (blue) and IRAS source (black).
Current usage metrics show cumulative count of Article Views (full-text article views including HTML views, PDF and ePub downloads, according to the available data) and Abstracts Views on Vision4Press platform.
Data correspond to usage on the plateform after 2015. The current usage metrics is available 48-96 hours after online publication and is updated daily on week days.
Initial download of the metrics may take a while.