Fig. 5
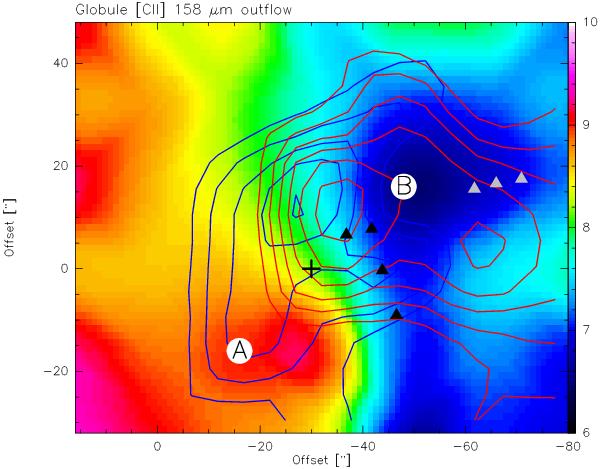
Close-up of the [C II] map of the globule with the peak line velocity in color, determined from a Gaussian fit to each spectrum. From each Gaussian fit, the excess emission in the blue (~4 to 7 km s-1) and redshifted (~9.5 to 11 km s-1) wing was determined and is plotted as blue and red contours (for better visibility the maps are resampled on a finer grid). The black triangles indicate the cluster members within the H II-region (note that this is where the hot gas, visible in CO J = 11 → 10 emission is found). The gray triangles mark the three sources from the secondary cluster.
Current usage metrics show cumulative count of Article Views (full-text article views including HTML views, PDF and ePub downloads, according to the available data) and Abstracts Views on Vision4Press platform.
Data correspond to usage on the plateform after 2015. The current usage metrics is available 48-96 hours after online publication and is updated daily on week days.
Initial download of the metrics may take a while.