Fig. 2
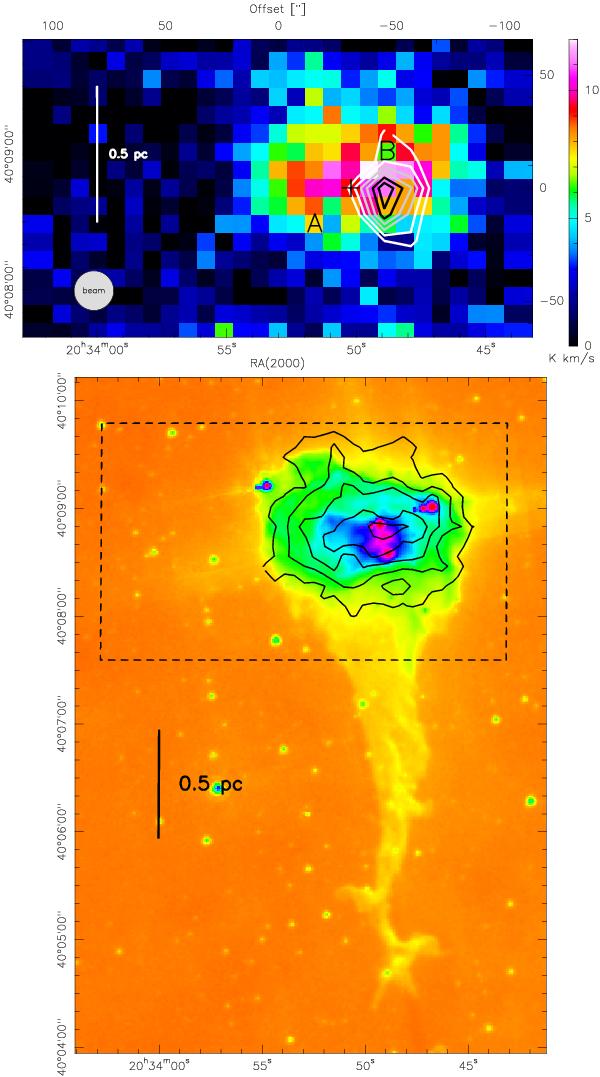
Top: map of [C II] emission (color-coded, integrated between 3 and 12 km s-1 in K km s-1 on a Tmb scale). The 0,0-position is RA(2000) = 20h33m53s Dec(2000) = 40°8′45′′. The contours (1 to 3.5 K km s-1 by 0.5 K km s-1) indicate the very confined CO J = 11 → 10 emission. Bottom: overlay of [C II] contours (3 to 11 K km s-1 by 2 K km s-1 in a Tmb scale) in black on the Spitzer 5.8 μm continuum emission. The central cluster and a smaller sub-cluster in the northwest in the head of the globule (in pink) are clearly visible. The dashed rectangle indicates the area mapped in [C II]. Labels A, B, and the cross indicate the positions of the [C II] spectra shown in Fig. 4.
Current usage metrics show cumulative count of Article Views (full-text article views including HTML views, PDF and ePub downloads, according to the available data) and Abstracts Views on Vision4Press platform.
Data correspond to usage on the plateform after 2015. The current usage metrics is available 48-96 hours after online publication and is updated daily on week days.
Initial download of the metrics may take a while.