Fig. 7
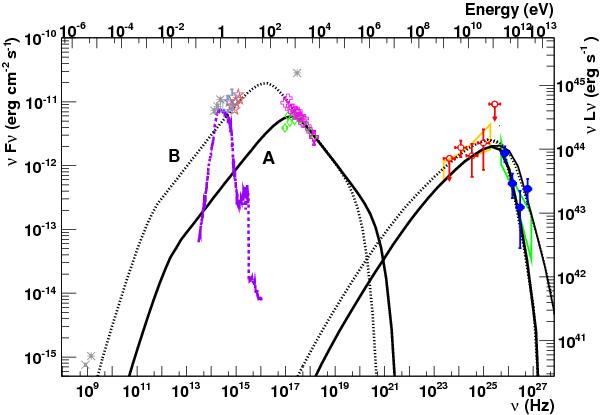
Spectral energy distribution of 1RXS J101015.9 − 311909. The H.E.S.S. spectrum is represented by the green bow-tie at the highest energies. The measured Fermi/LAT spectrum above 1 GeV is represented by the orange full bow-tie, while the binned spectral points or upper limits are shown with empty circles (see Sect. 3.1 for details). The Swift/XRT spectrum in case A is shown with green diamonds, while case B is represented with pink crosses. NED database archival data are shown with grey asterisks, while the grey cross represents the flux measured by the SUMSS radio survey (see Sect. 1). Swift/UVOT data are shown with light-red stars; atom data are shown with light-blue squares. Deabsorbed infrared-to-UV data are plotted for case B only to avoid cluttering. The total SSC emission model (including absorption by the EBL) in case A is represented by the solid line, while the modelling in case B is represented by the dashed line. The intrinsic emission models (corrected for EBL absorption) are presented by the thinner lines at higher VHE flux. A template of a spectrum of a giant elliptical galaxy is also shown in the plot by the dashed purple line in the optical range.
Current usage metrics show cumulative count of Article Views (full-text article views including HTML views, PDF and ePub downloads, according to the available data) and Abstracts Views on Vision4Press platform.
Data correspond to usage on the plateform after 2015. The current usage metrics is available 48-96 hours after online publication and is updated daily on week days.
Initial download of the metrics may take a while.