Fig. 6
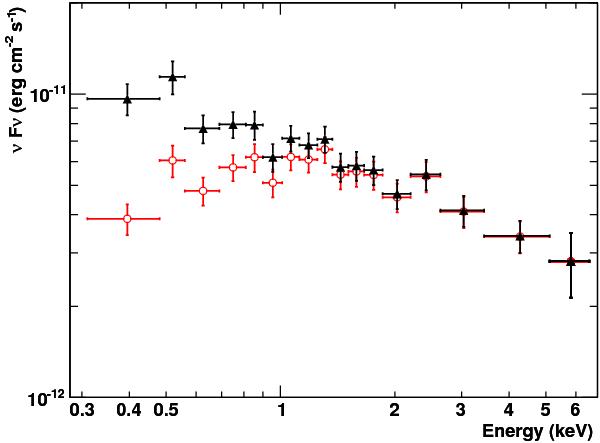
The two Swift/XRT spectra for case A (galactic absorption only) and B (additional absorption), corrected for the respective absorptions, are shown in this figure by the red points and the black triangles, respectively. For simplicity, only the spectrum from the pc-mode observations, rebinned for plotting purposes, is presented.
Current usage metrics show cumulative count of Article Views (full-text article views including HTML views, PDF and ePub downloads, according to the available data) and Abstracts Views on Vision4Press platform.
Data correspond to usage on the plateform after 2015. The current usage metrics is available 48-96 hours after online publication and is updated daily on week days.
Initial download of the metrics may take a while.