Fig. 5
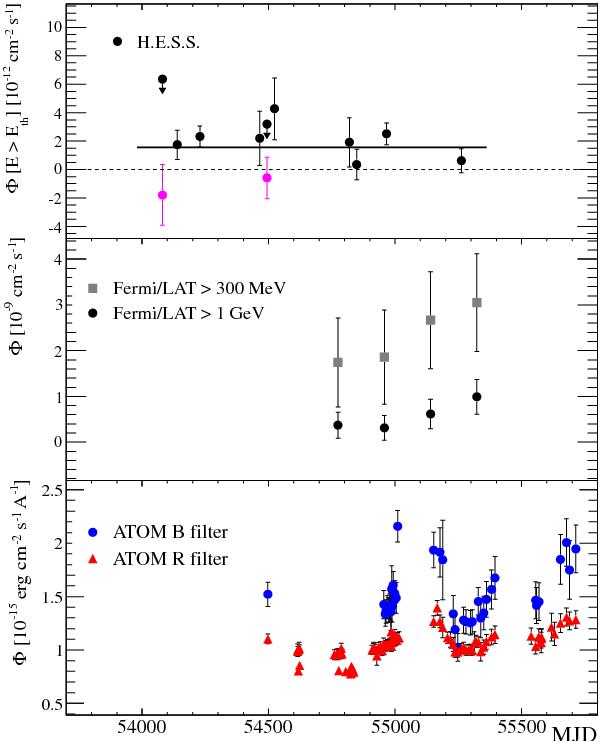
Upper panel: light curve of H.E.S.S. observations. The mean flux above 0.2 TeV per observing period (between two full moons) is shown as a function of the time in MJD. Only statistical errors are shown. Upper limits at 99% confidence level are calculated when no signal is found and in this case the corresponding negative fluxes are shown in magenta. The solid line represents the fit of a constant to the H.E.S.S. data. Middle panel: light curves of Fermi/LAT observations for the Eth > 300 MeV and Eth > 1 GeV thresholds in a 6-month binning. The first two flux points of the Eth > 300 MeV light curve and the first three flux points of the Eth > 1 GeV light curve have a TS < 9. Bottom panel: light curve of atom observations with R and B filters, corrected for Galactic extinction assuming EB − V = 0.104 (case A).
Current usage metrics show cumulative count of Article Views (full-text article views including HTML views, PDF and ePub downloads, according to the available data) and Abstracts Views on Vision4Press platform.
Data correspond to usage on the plateform after 2015. The current usage metrics is available 48-96 hours after online publication and is updated daily on week days.
Initial download of the metrics may take a while.