Fig. 4
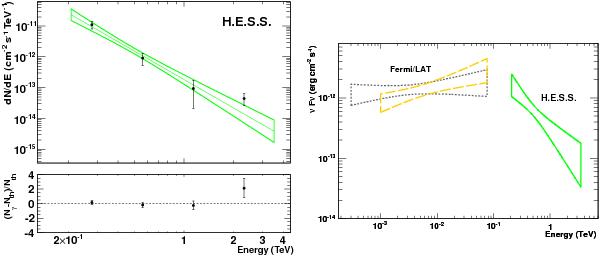
Left panel: time-averaged VHE spectrum measured from the direction of 1RXS J101015.9 − 311909. The bow-tie represents 1σ confidence level error band of the fitted spectrum using a power-law hypothesis. The lower panel shows the fit residuals, i.e. (Nγ − Ntheo)/Ntheo, where Nγ and Ntheo are the detected and expected number of excess events, respectively. Right panel: Fermi/LAT and H.E.S.S. bow-ties. The two Fermi/LAT bow-ties represent the Eth > 300 MeV (dotted line) and the Eth > 1 GeV (dashed line) spectral results. All the bow-ties (H.E.S.S. and Fermi/LAT) result from a forward-folding spectral analysis technique.
Current usage metrics show cumulative count of Article Views (full-text article views including HTML views, PDF and ePub downloads, according to the available data) and Abstracts Views on Vision4Press platform.
Data correspond to usage on the plateform after 2015. The current usage metrics is available 48-96 hours after online publication and is updated daily on week days.
Initial download of the metrics may take a while.