Fig. 1
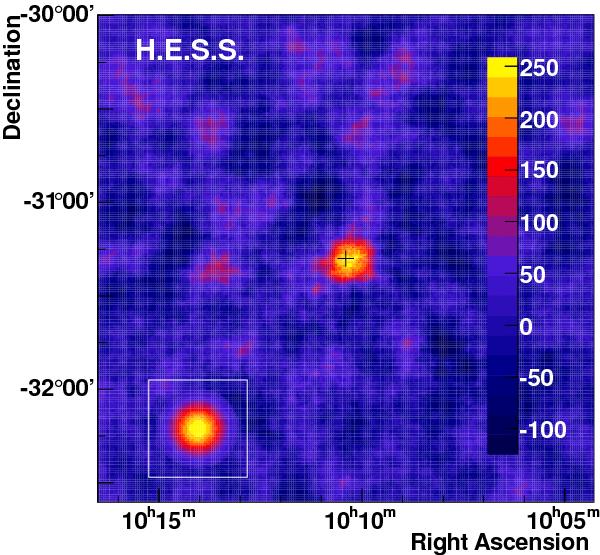
Image of 1RXS J101015.9−311909 in right ascension and declination (J2000) of the γ-ray excess found by H.E.S.S. oversampled with the 68% containment radius of the point spread function (0.11° for these analysis cuts). The cross represents the nominal position of the source. The inset on the lower left shows the expected γ-ray excess distribution from a point-like source.
Current usage metrics show cumulative count of Article Views (full-text article views including HTML views, PDF and ePub downloads, according to the available data) and Abstracts Views on Vision4Press platform.
Data correspond to usage on the plateform after 2015. The current usage metrics is available 48-96 hours after online publication and is updated daily on week days.
Initial download of the metrics may take a while.