Fig. 5
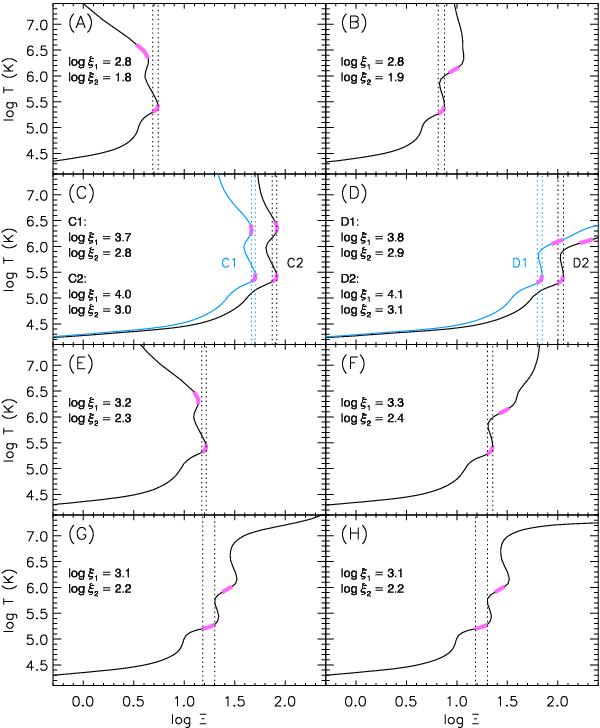
Different stability curves (A)–H)) calculated for the corresponding SEDs (A)–H)) of Fig. 4. In panels C) and D), the curves in blue correspond to SEDs C1 and D1 and the ones in black to SEDs C2 and D2. The positions of the warm absorber phases (Phase 1 and 2), along with their 2σ (95.4%) errors, are indicated as thick magenta strips on the curves. Phase 1 is the one with higher T. The ionisation parameters of Phase 1 and 2 (i.e. ξ1 and ξ2) in units of erg cm s-1 are given for each corresponding stability curve. The dotted lines are plotted for display purposes to show the range of Ξ for one of the phases on each curve. The regions overlapping in Ξ on each stability curve are in pressure equilibrium.
Current usage metrics show cumulative count of Article Views (full-text article views including HTML views, PDF and ePub downloads, according to the available data) and Abstracts Views on Vision4Press platform.
Data correspond to usage on the plateform after 2015. The current usage metrics is available 48-96 hours after online publication and is updated daily on week days.
Initial download of the metrics may take a while.