Fig. 4
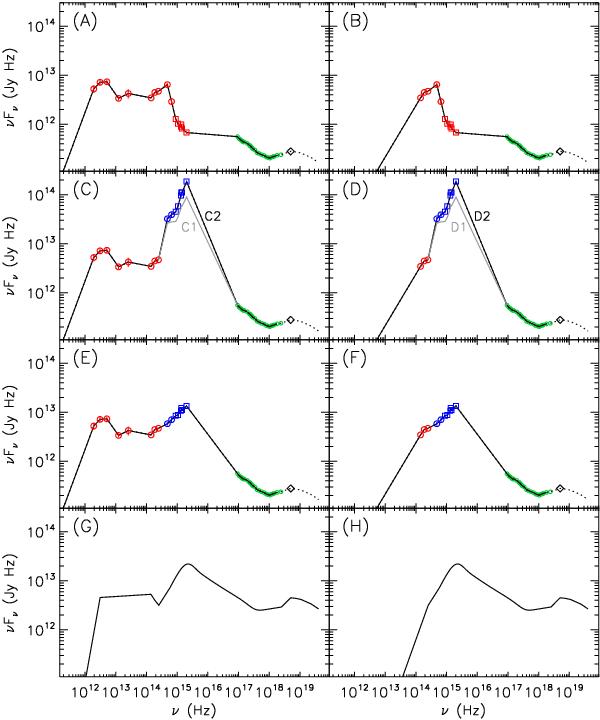
The different SEDs (A)–H)) assumed in the modelling of ESO 113-G010warm absorber as described in Sects. 4 and 5, which were used in the ionisation balance calculations. The IR and optical data points (Sect. 5.2) are shown as circles and the UV data (Sect. 5.3) as squares. The data points in red are corrected only for Galactic extinction as described in Sect. 5.1, whereas the blue data points (in panels C)–F)) are also corrected for nuclear obscuration in the AGN as described in Sects. 3.1 and 3.2. The SEDs in panels C) and D) have been corrected for nuclear obscuration by using the Balmer decrement and the ones in panels E and F have been corrected for nuclear obscuration by using the continuum reddening. In panels C) and D), the SEDs with some parts shown in grey and no data points correspond to nuclear obscuration correction with an intrinsic E(B − V) = 0.64 (named SEDs C1 and D1) and the ones with blue data points superimposed on the curve correspond to nuclear obscuration correction with an intrinsic E(B − V) = 0.73 (named SEDs C2 and D2). The radio point (Sect. 5.2) is not displayed in this figure due to its low flux. The EPIC-pn X-ray data corrected for Galactic absorption are shown as small green circles. The black diamonds correspond to flux at 20 keV extrapolated from the EPIC-pn spectrum, and the extrapolations to the higher energy parts of the SED, shown as dotted lines, are described in Sect. 5.3. SED G is the SED of Mrk 509 introduced in Sect. 4 and used as a “standard” representation for a Seyfert AGN. SEDs on the right-hand side (B), D), F), H)) are the same as their adjacent SEDs on the left (A), C), E), G)) but without the IR bump and are used in modelling cases where the warm absorber does not receive IR radiation from the dusty torus.
Current usage metrics show cumulative count of Article Views (full-text article views including HTML views, PDF and ePub downloads, according to the available data) and Abstracts Views on Vision4Press platform.
Data correspond to usage on the plateform after 2015. The current usage metrics is available 48-96 hours after online publication and is updated daily on week days.
Initial download of the metrics may take a while.