Fig. 10
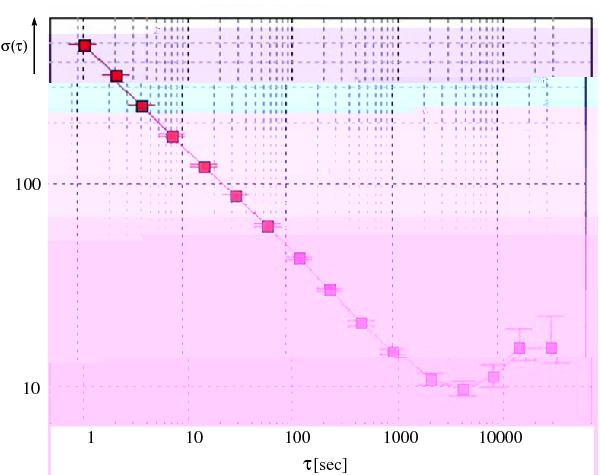
Remarkable stability of the FFTS is illustrated in this Allan-variance plot. The spectrum of a laboratory noise source was integrated and processed in the AFFTS. The spectroscopic variance between two ~1 MHz (ENBW) wide frequency channels, separated by 800 MHz within the band, was determined to be stable on a time scale of ~4000 s.
Current usage metrics show cumulative count of Article Views (full-text article views including HTML views, PDF and ePub downloads, according to the available data) and Abstracts Views on Vision4Press platform.
Data correspond to usage on the plateform after 2015. The current usage metrics is available 48-96 hours after online publication and is updated daily on week days.
Initial download of the metrics may take a while.