Fig. 6
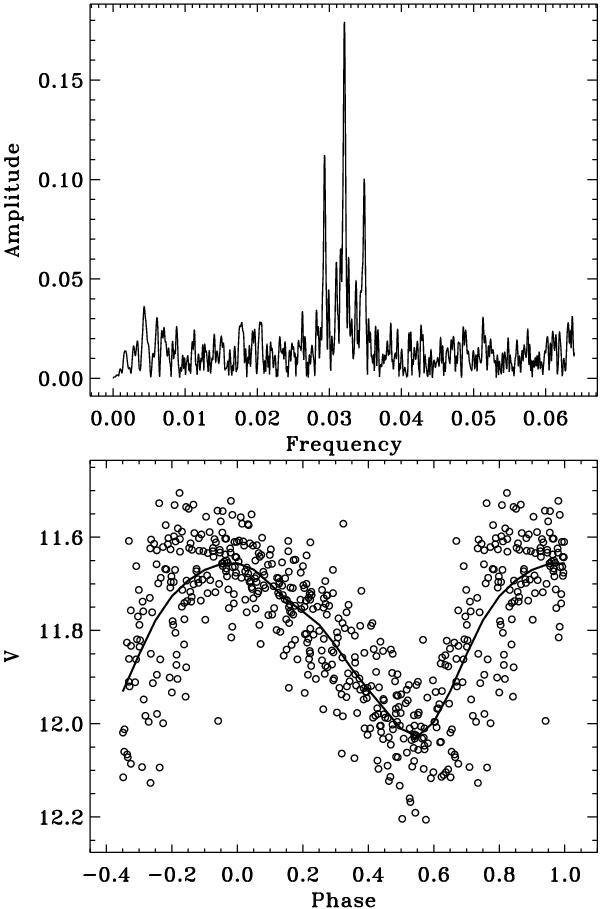
Frequency spectrum (top) and the phased V light curve (bottom) of IRAS 11472−0800 based on the period of 31.16 d. The spread in the phased light curve is due in part to the apparent seasonal shifts in the phase of the light curve (see Fig. 7). The solid line is a fit to the data averaged in phase bins. (Note that the data from the 2000–2001 and 2001–2002 seasons have been excluded.)
Current usage metrics show cumulative count of Article Views (full-text article views including HTML views, PDF and ePub downloads, according to the available data) and Abstracts Views on Vision4Press platform.
Data correspond to usage on the plateform after 2015. The current usage metrics is available 48-96 hours after online publication and is updated daily on week days.
Initial download of the metrics may take a while.