Free Access
Fig. 10
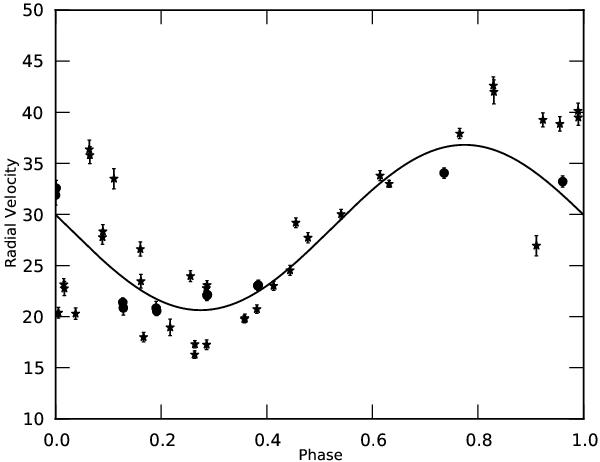
Radial velocity data folded on the pulsation period of 31.16 days. The solid line shows a sine curve through a single, well-sampled cycle for which the data are plotted as filled circles. All other data are plotted as filled stars.
Current usage metrics show cumulative count of Article Views (full-text article views including HTML views, PDF and ePub downloads, according to the available data) and Abstracts Views on Vision4Press platform.
Data correspond to usage on the plateform after 2015. The current usage metrics is available 48-96 hours after online publication and is updated daily on week days.
Initial download of the metrics may take a while.