Fig. 7
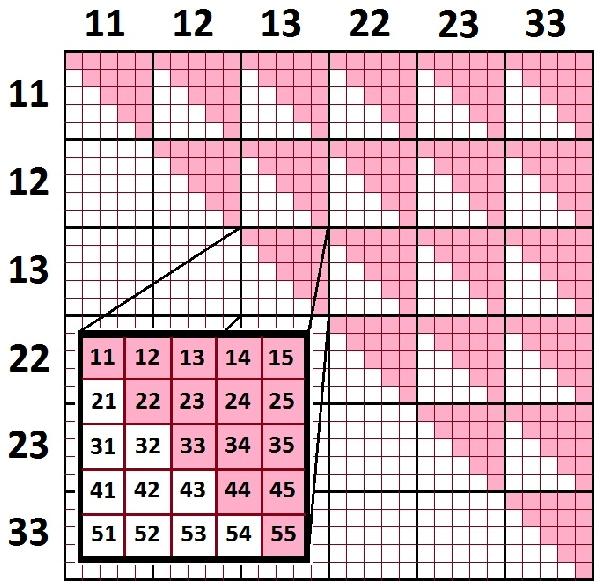
Representation of a tomographic covariance. In this diagram 3 redshift-bins (1, 2, 3) and 5 COSEBIs modes are assumed to be present. The blow-up shows one of the covariance building blocks; the numbers 1−5 show the COSEBIs mode considered, e.g. 15 means the covariance of E1 and E5. The numbers on the sides of the matrix show which combination of redshift bins is considered, e.g., 12 means the covariance of redshift-bins 1 and 2 is relevant. Due to symmetry, only a part of the covariance elements have to be calculated, here shown in pink.
Current usage metrics show cumulative count of Article Views (full-text article views including HTML views, PDF and ePub downloads, according to the available data) and Abstracts Views on Vision4Press platform.
Data correspond to usage on the plateform after 2015. The current usage metrics is available 48-96 hours after online publication and is updated daily on week days.
Initial download of the metrics may take a while.