Fig. 5
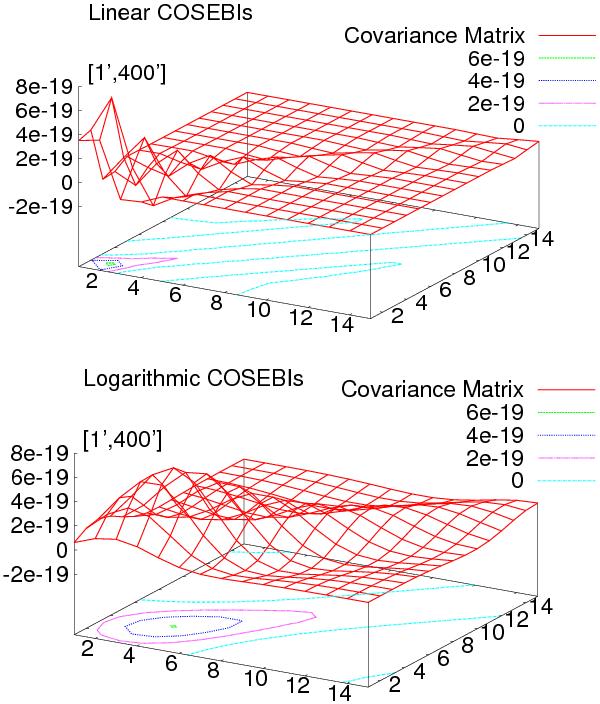
3D representation of the non-tomographic covariance of 15 E-mode COSEBIs for an angular range of [1′,400′] , for MS parameters. The x- and y-axes correspond to the elements of the covariance matrix, and the value of the vertical axis shows the value of the covariance of the corresponding element. A contour representation of the covariance is shown for each plot at its base.
Current usage metrics show cumulative count of Article Views (full-text article views including HTML views, PDF and ePub downloads, according to the available data) and Abstracts Views on Vision4Press platform.
Data correspond to usage on the plateform after 2015. The current usage metrics is available 48-96 hours after online publication and is updated daily on week days.
Initial download of the metrics may take a while.