Fig. 4
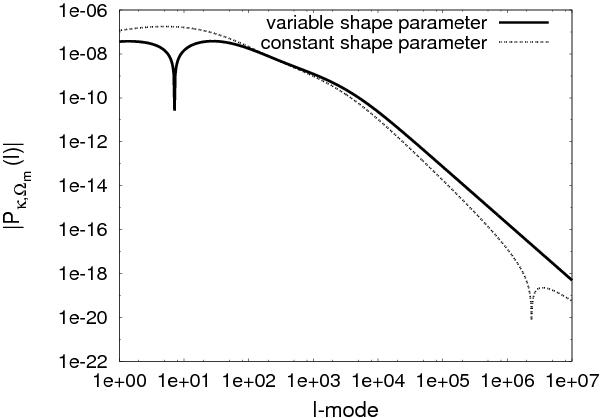
Absolute value of the derivative of the convergence power spectrum with respect to Ωm. Both of the curves rely on a five point stencil method where 4 nearby points have to be evaluated. The solid curve is drawn assuming all parameters are fixed except Ωm and Γ, in contrast to the dotted curve where instead of Γ, h or Ωb are variable.
Current usage metrics show cumulative count of Article Views (full-text article views including HTML views, PDF and ePub downloads, according to the available data) and Abstracts Views on Vision4Press platform.
Data correspond to usage on the plateform after 2015. The current usage metrics is available 48-96 hours after online publication and is updated daily on week days.
Initial download of the metrics may take a while.