Fig. 12
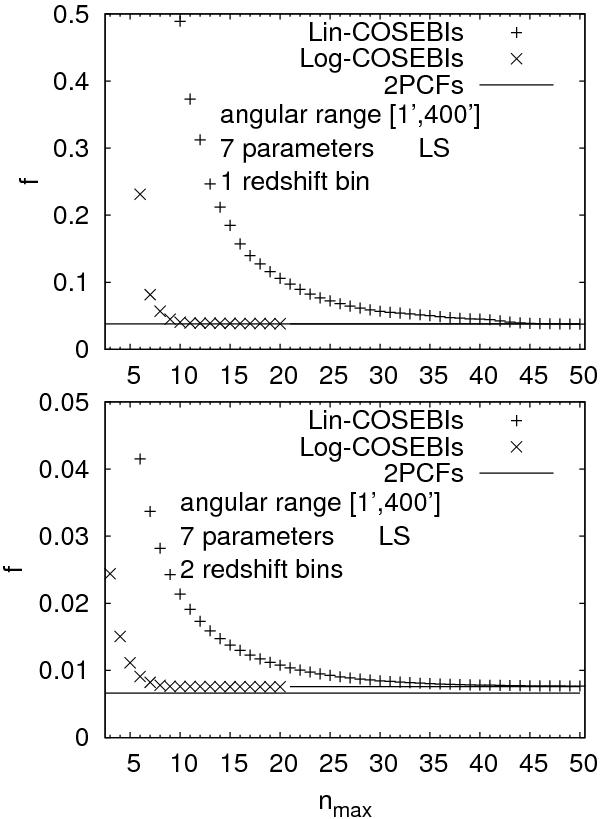
Comparison between the Lin- and Log-COSEBIs results. These plots show one of our consistency checks. We consider the LS parameter with a single (top panel) and two galaxy redshift distributions (bottom panel), including all of the 7 parameters. Apart from very small numerical inaccuracies, both sets of COSEBIs saturate to the same value, as expected. There are two solid lines in each plot. The line with the higher value shows the value of Log-COSEBIs at nmax = 20, and the other line shows the value of f as obtained from the shear 2PCFs. The slightly smaller value of f in the latter case (this difference is not visible in the plot) is related to the fact that the analysis from the shear 2PCFs implicitly assume the absence of B-modes, and thus contains information from very large-scale modes which, however, cannot be uniquely assigned to either E- or B-modes. The comparison of the two plots shows that dividing the galaxies into two redshift bins not only increases the information content of the Fisher analysis but also decreases the number of COSEBIs modes needed.
Current usage metrics show cumulative count of Article Views (full-text article views including HTML views, PDF and ePub downloads, according to the available data) and Abstracts Views on Vision4Press platform.
Data correspond to usage on the plateform after 2015. The current usage metrics is available 48-96 hours after online publication and is updated daily on week days.
Initial download of the metrics may take a while.