Free Access
Fig. A.1
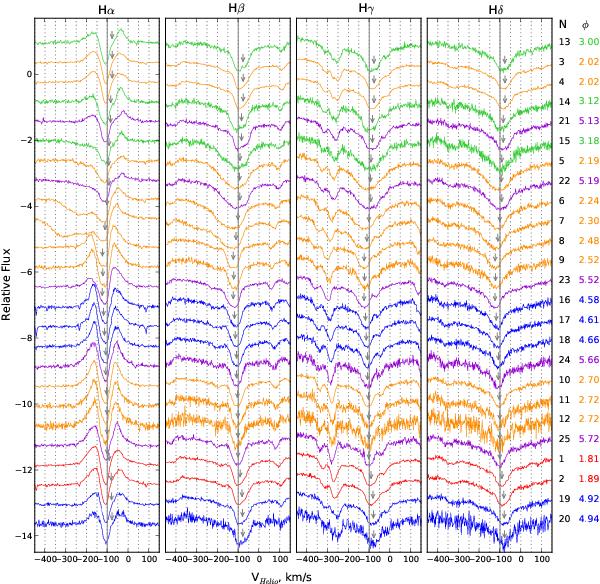
Balmer lines as a function of the RV phase (φ = 0 corresponds to the maximum redshift). Different colours denote different orbital cycles. A solid vertical line marks our systemic velocity of −98.9 km s-1, while dotted lines mark 50 km s-1 intervals from it. The arrows mark the photospheric velocity according to the CCF.
Current usage metrics show cumulative count of Article Views (full-text article views including HTML views, PDF and ePub downloads, according to the available data) and Abstracts Views on Vision4Press platform.
Data correspond to usage on the plateform after 2015. The current usage metrics is available 48-96 hours after online publication and is updated daily on week days.
Initial download of the metrics may take a while.