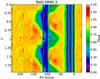
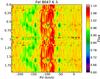
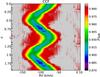
Fig. 10
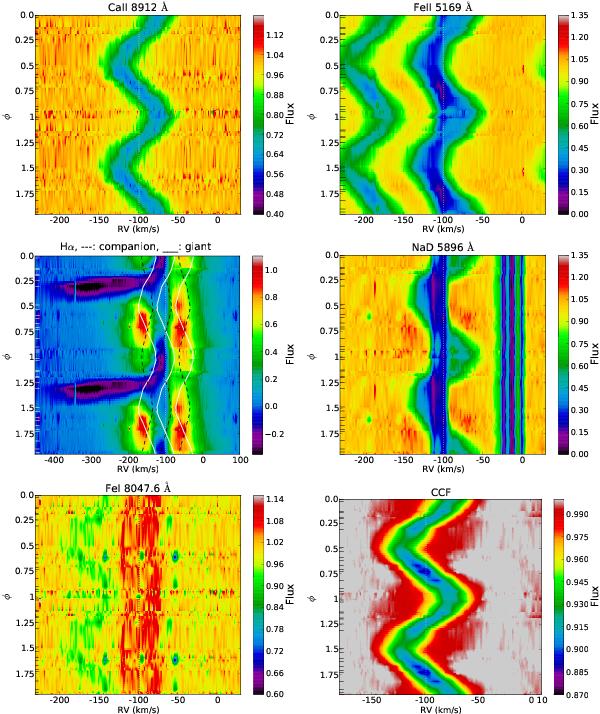
Dynamic spectra of selected lines and the CCF as a function of the orbital phase (time runs from top to bottom). Colours designate continuum-normalized fluxes (except for Hα), with black corresponding to the strongest absorption. Fluxes in the missing phases were obtained by a linear interpolation between the nearest observed phases. Dotted vertical line marks the systemic velocity, while the horizontal dashes on the left indicate the observed phases. One orbital period is shown twice to guide the eye. Hα is plotted after subtraction of the photospheric model spectrum; solid and dashed lines represent the RV curves (original and ± 50 km s-1 offset) of the giant and of the putative companion to illustrate the lack of significant motion in the emission component. Only data from the first two seasons of observations are shown (spectra 1−25, obtained between July 2009−January 2011); later observations confirm the general behaviour with phase, but the intensities of the circumstellar features appear to vary slightly from cycle to cycle.
Current usage metrics show cumulative count of Article Views (full-text article views including HTML views, PDF and ePub downloads, according to the available data) and Abstracts Views on Vision4Press platform.
Data correspond to usage on the plateform after 2015. The current usage metrics is available 48-96 hours after online publication and is updated daily on week days.
Initial download of the metrics may take a while.