Fig. 6
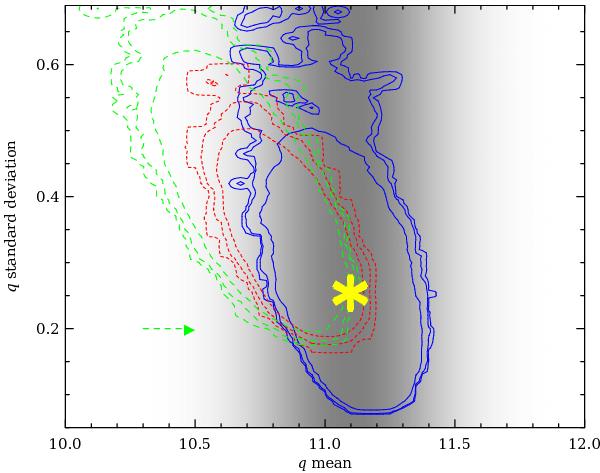
Credible contours for the logarithmic X-ray/radio ratio q. The Bayes formula was used to derive the posterior probability for q, shown as contours (levels relative to 50%, 68.3% and 90%). The blue continuous and the green long-dashed contours refer to SF objects with z ≤ 0.2 and z > 0.2, respectively. The red short-dashed contours refer to SF objects at any redshift (i.e., the sum of the two bins). The green long-dashed arrow shows the correction that should be made to q for the z > 0.2 and any-z bins to account for the bias due to radio selection. The grey-scale background shows the prior (a darker grey means a higher probability density). The yellow asterisk shows the q0 value from RCS03.
Current usage metrics show cumulative count of Article Views (full-text article views including HTML views, PDF and ePub downloads, according to the available data) and Abstracts Views on Vision4Press platform.
Data correspond to usage on the plateform after 2015. The current usage metrics is available 48-96 hours after online publication and is updated daily on week days.
Initial download of the metrics may take a while.