Fig. 5
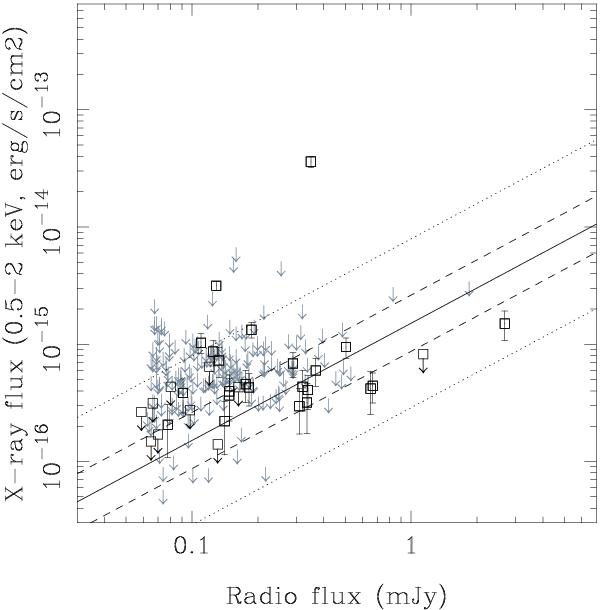
Radio vs. X-ray (0.5–2 keV) fluxes for the VLA-COSMOS SF sources detected in C-COSMOS. Detected sources are marked with squares and error bars. The black squares with an attached arrow mark the sources which are not detected in the band to which the panel refers, but are detected in any other of the C-COSMOS bands. Conversely, the grey upper limits show the sources without a detection in any X-ray band, hence without an entry in the C-COSMOS catalogue. The solid line shows the RCS03 relationship, K-corrected to the average redshift of the detected sources (z = 0.46), while the dashed lines show the 1 × and 3 × standard deviation of the relationship.
Current usage metrics show cumulative count of Article Views (full-text article views including HTML views, PDF and ePub downloads, according to the available data) and Abstracts Views on Vision4Press platform.
Data correspond to usage on the plateform after 2015. The current usage metrics is available 48-96 hours after online publication and is updated daily on week days.
Initial download of the metrics may take a while.