Fig. 8
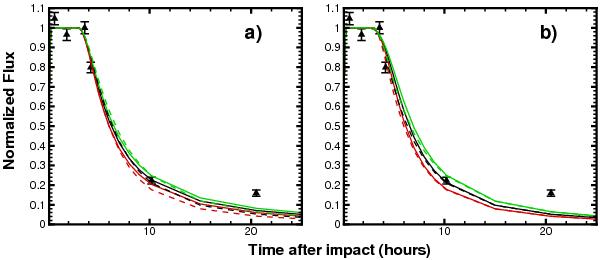
Model fits to the flux at 5.7 μm from ejecta observed in the nucleus-centered 9.25′′ × 9.25′′ extraction. Fluxes are normalized to the value measured at TI + 3.6 h. Data are shown with filled symbols with error bars. Results from a time-dependent dust model considering a short-duration (1000 s) outburst are shown both for a power-law size distribution a) and a Hanner distribution b) for amorphous carbon grains (solid line) and two-layer grains (dashed line). Black lines are for the best slope of the velocity distribution qv, green lines are for qv + 0.05 and red lines are for qv − 0.05. The value of vref = 230 m s-1.
Current usage metrics show cumulative count of Article Views (full-text article views including HTML views, PDF and ePub downloads, according to the available data) and Abstracts Views on Vision4Press platform.
Data correspond to usage on the plateform after 2015. The current usage metrics is available 48-96 hours after online publication and is updated daily on week days.
Initial download of the metrics may take a while.