Fig. 5
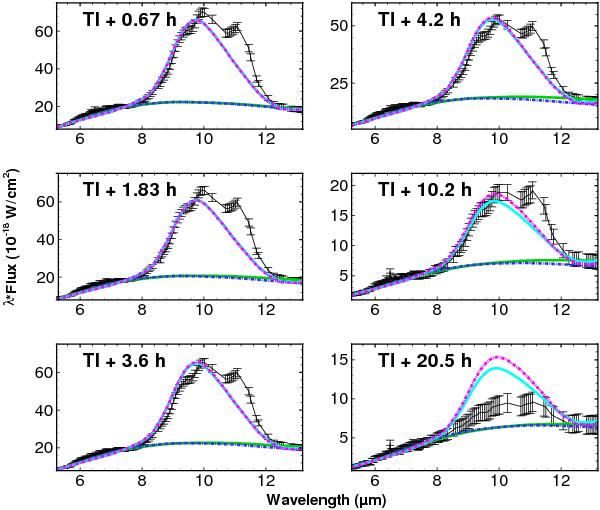
Model fits to the ejecta SED observed in 9.25′′ × 9.25′′ FOV nucleus-centered extractions. The different colors correspond to different size distributions and composition materials. Green: power law distribution and amorphous carbon. Cyan: power law distribution and two-layer grains. Blue (dash-dotted line): Hanner distribution and amorphous carbon grains. Purple (dash-dotted line): Hanner distribution and two-layer grains. We explicitly model the continuum emission only, ignoring the contribution from small cyrstalline silicates. The cyan and purple curves overlap at times TI + 0.67 h, TI + 1.83 h, TI + 3.6 h, TI + 4.2 h and TI + 10.2 h. The blue and green curves overlap in all plots.
Current usage metrics show cumulative count of Article Views (full-text article views including HTML views, PDF and ePub downloads, according to the available data) and Abstracts Views on Vision4Press platform.
Data correspond to usage on the plateform after 2015. The current usage metrics is available 48-96 hours after online publication and is updated daily on week days.
Initial download of the metrics may take a while.