Fig. 15
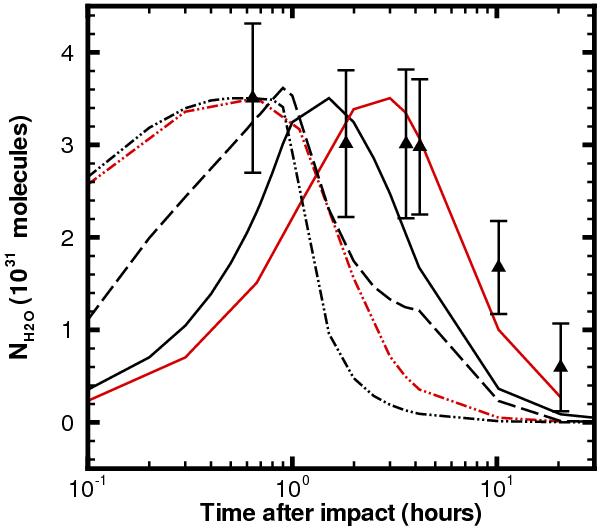
Temporal evolution of the number of water molecules within the FOV computed with our time-dependent models of sublimating icy grains. Curves are displayed for pure ice grains (solid line), three-layer grains with a fractional mass of the mantle component αice = 0.9 (dash-dotted-dotted line) and two-layer (Ol) grains with αice = 0.98 (long-dashed line). The outputs from the models with rarefied medium and dense medium are shown in red and black, respectively. The filled triangles are the number of water molecules derived from the analysis of the Spitzer spectra. The model results have been adjusted so that the curves peak at (3.5 ± 0.8) × 1031 molecules, which corresponds to the observed value at TI + 0.67 h.
Current usage metrics show cumulative count of Article Views (full-text article views including HTML views, PDF and ePub downloads, according to the available data) and Abstracts Views on Vision4Press platform.
Data correspond to usage on the plateform after 2015. The current usage metrics is available 48-96 hours after online publication and is updated daily on week days.
Initial download of the metrics may take a while.