Fig. 3
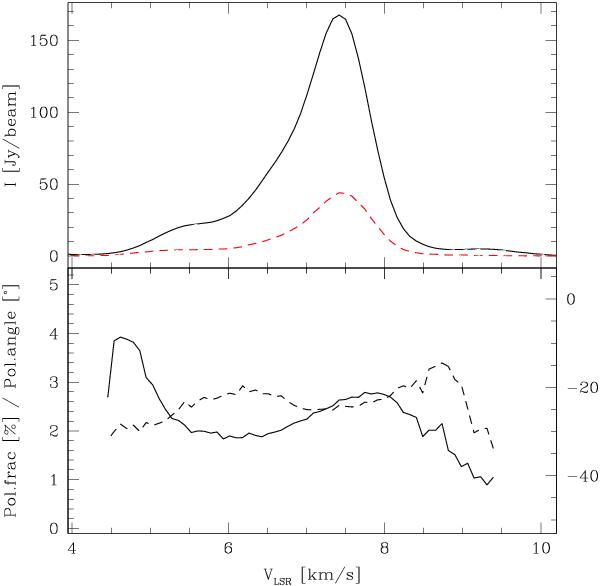
Stokes I (black line) and linear polarization intensity (multiplied by a factor of ten, red dashed line) spectra of the water maser emission (upper panel). The spectra of polarization fraction (black line, left scale) and position angle (dashed line, right scale) are also shown (lower panel). (A color version of this figure is provided in the online version.)
Current usage metrics show cumulative count of Article Views (full-text article views including HTML views, PDF and ePub downloads, according to the available data) and Abstracts Views on Vision4Press platform.
Data correspond to usage on the plateform after 2015. The current usage metrics is available 48-96 hours after online publication and is updated daily on week days.
Initial download of the metrics may take a while.