Fig. 2
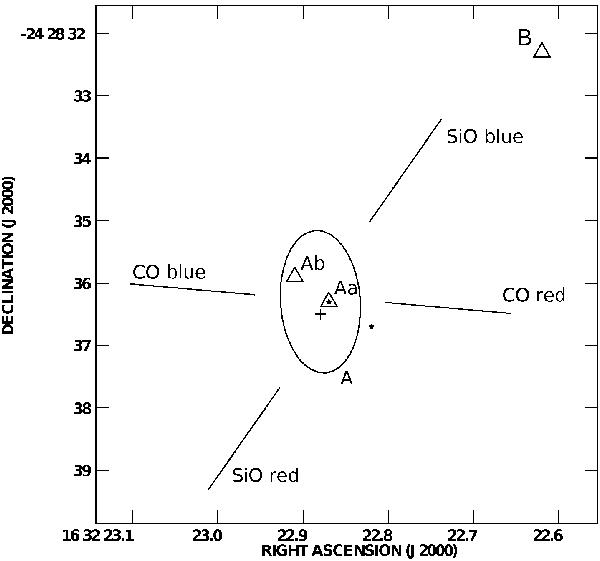
Scheme of the distribution of dust and molecular material in I16293. The plus signal indicates the position of the peak intensity of our VLA water maser data. The ellipse is the deconvolved size of the dust continuum source A as derived by Rao et al. (2009). Triangles denote the position of the submillimeter condensations observed by Chandler et al. (2005). Stars denote the VLBI water maser detections of Imai et al. (2007) and straight lines denotes the direction of the CO and SiO outflows associated with this core (Rao et al. 2009).
Current usage metrics show cumulative count of Article Views (full-text article views including HTML views, PDF and ePub downloads, according to the available data) and Abstracts Views on Vision4Press platform.
Data correspond to usage on the plateform after 2015. The current usage metrics is available 48-96 hours after online publication and is updated daily on week days.
Initial download of the metrics may take a while.