Free Access
Fig. 9
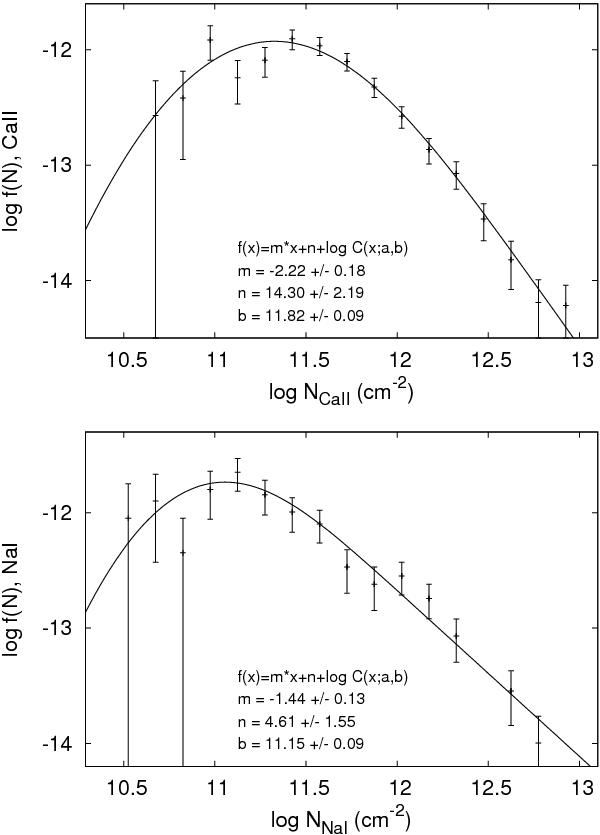
The Ca ii and Na i column density distributions f(N) (using logarithmic binning). The solid lines represent a power-law fit under consideration of the completeness function of our sample. From χ2-fitting we obtain a slope of β = −2.2 ± 0.2 for Ca ii and β = −1.4 ± 0.1 for Na i.
This figure is made of several images, please see below:
Current usage metrics show cumulative count of Article Views (full-text article views including HTML views, PDF and ePub downloads, according to the available data) and Abstracts Views on Vision4Press platform.
Data correspond to usage on the plateform after 2015. The current usage metrics is available 48-96 hours after online publication and is updated daily on week days.
Initial download of the metrics may take a while.