Fig. 3
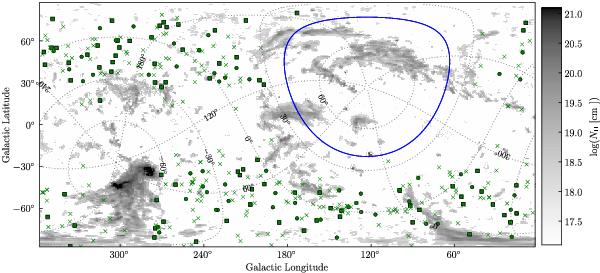
HVC-all-sky map derived from the data of the LAB Survey (Kalberla et al. 2005) using a simple model of Galactic rotation kindly provided by Westmeier (for details see Westmeier 2007). The different symbols mark the locations of 408 QSO sight lines that were observed with UVES. Along 126 (75) lines of sight we detect Ca ii (Na i) absorption components (marked with circles and boxes). The boxes mark the positions where we found corresponding H i emission. The crosses show non-detections. The blue line marks the region not accessible with the VLT (δ ≳ 40°). Furthermore, the Galactic plane is not covered by our sample.
Current usage metrics show cumulative count of Article Views (full-text article views including HTML views, PDF and ePub downloads, according to the available data) and Abstracts Views on Vision4Press platform.
Data correspond to usage on the plateform after 2015. The current usage metrics is available 48-96 hours after online publication and is updated daily on week days.
Initial download of the metrics may take a while.